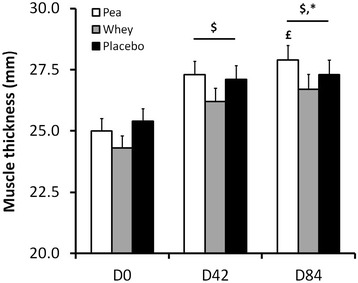
Figure 3.

Changes in biceps brachii thickness (mm) during the experimental protocol. $: Significant difference within each group compared with D0 (P < 0.0001). £: Tending towards significance compared with D42 for the Pea group only (P = 0.09). *: Between group comparison between D0 and D84 approaching significance (P = 0.09).
