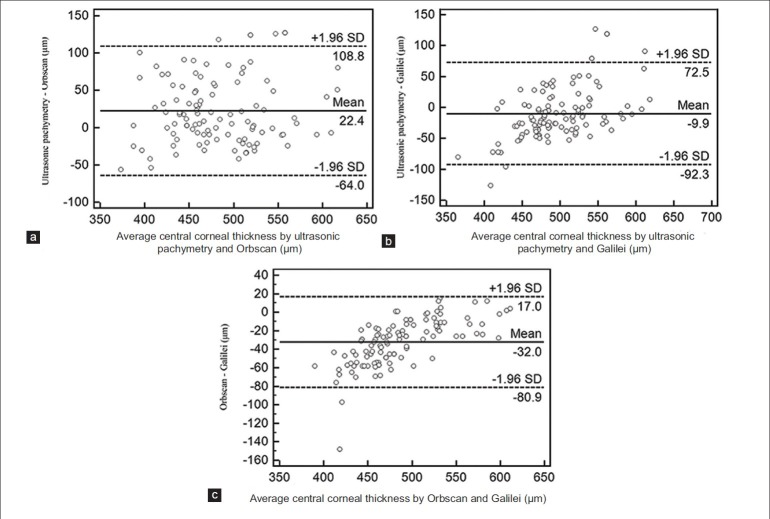
Figure 5.
Bland–Altman plots in the keratoconus group; difference of central corneal thickness against mean central corneal thickness measured with the Orbscan system and ultrasonic pachymetry (a), with the Galilei system and ultrasonic pachymetry (b), and with the Galilei and Orbscan II systems (c). The solid (middle) lines indicate the mean difference and the dotted (side) lines represent the upper and lower borders of the 95% limits of agreement.

