
Figure 6.
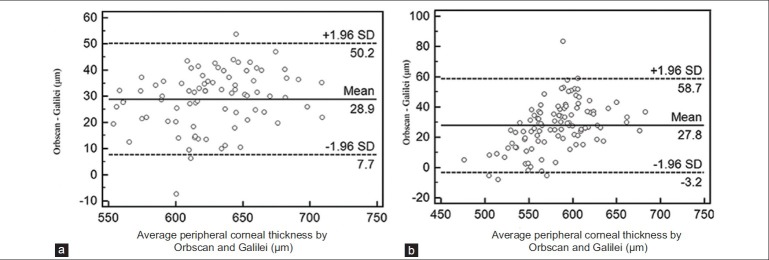
Bland–Altman plots in the normal (a) and keratoconus (b) groups; difference of peripheral corneal thickness against mean peripheral corneal thickness measured with the Orbscan II and the Galilei systems.
Official websites use .gov
A
.gov website belongs to an official
government organization in the United States.
Secure .gov websites use HTTPS
A lock (
) or https:// means you've safely
connected to the .gov website. Share sensitive
information only on official, secure websites.
Bland–Altman plots in the normal (a) and keratoconus (b) groups; difference of peripheral corneal thickness against mean peripheral corneal thickness measured with the Orbscan II and the Galilei systems.