Figure 5.

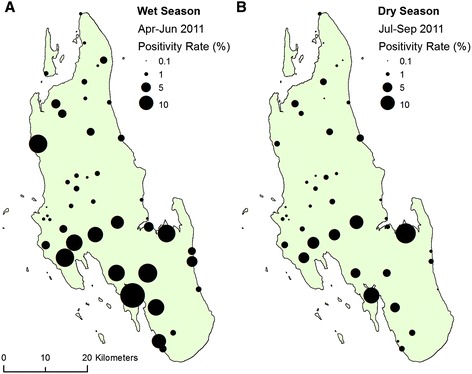
Maps of malaria positivity rates recorded at health facilities across Unguja, Zanzibar for the 2011 wet (A) and dry (B) seasons displayed as proportional symbols. Data from the [10].

Maps of malaria positivity rates recorded at health facilities across Unguja, Zanzibar for the 2011 wet (A) and dry (B) seasons displayed as proportional symbols. Data from the [10].