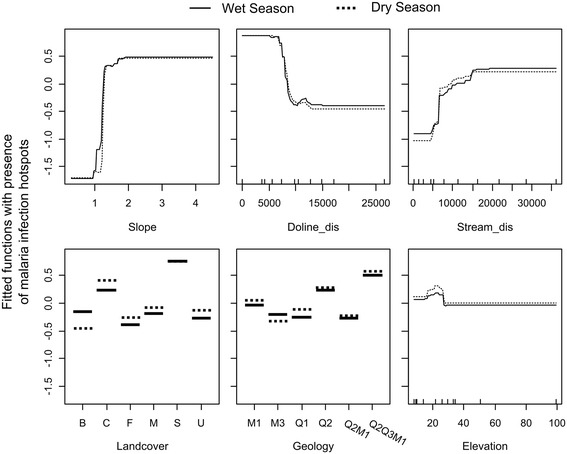
Figure 6.

Fitted function plots for the independent landscape variables in the model for predicting 2011 wet and dry season malaria infection hotspots on Unguja, Zanzibar. B = bushland, C = cultivated, F = natural forest, M = mangrove, S = scrub, U = urban. See Table 2 for a description of other variables and units. The variables soil infiltration rate and health facility condition are not included due their negligible influence on the models (see Table 4).
