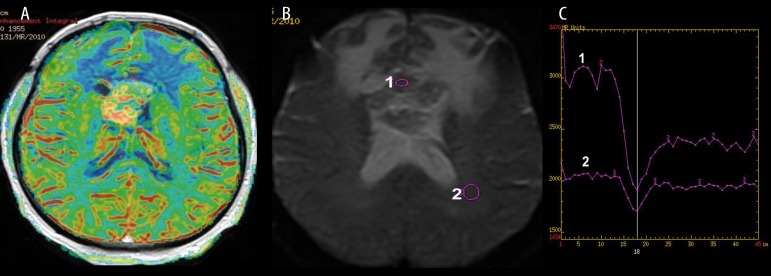
Figure 1.
Midline glioblastoma multiforme, DSC perfusion weighted imaging. (A) Cerebral Blood Volume Map showing malignant hyperperfusion within the tumor core, (B) source T2 image showing hypointense tumor after contrast injection, (C) perfusion signal-intensity curve showing typical T2 signal drop during contrast passage through the tumor core (1) and the white matter (2).

