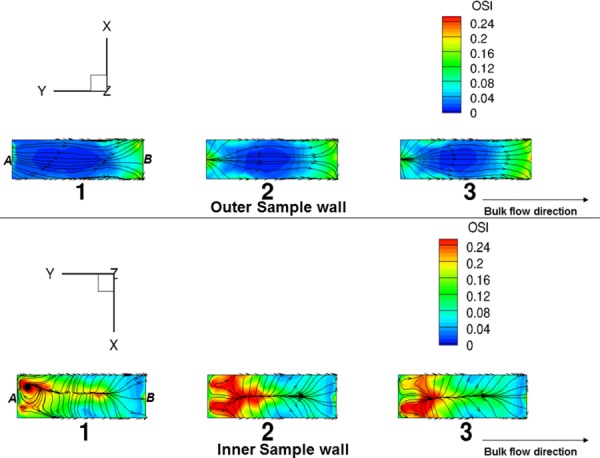
Fig. 12.

OSI distribution on the outer (top) and inner (bottom) wall of the three bioreactor specimens for case A (Re = 1376). The streamlines represent the mean shear stress pattern on the sample surface. As seen, OSI values were clearly much higher on the sample inner wall suggestive of utilization of the bioreactor device for cell mechanobiology studies involving oscillatory shear stress. Note that reference positions proximal to the fixed and moving post have been labeled as A and B in the figure, respectively.
