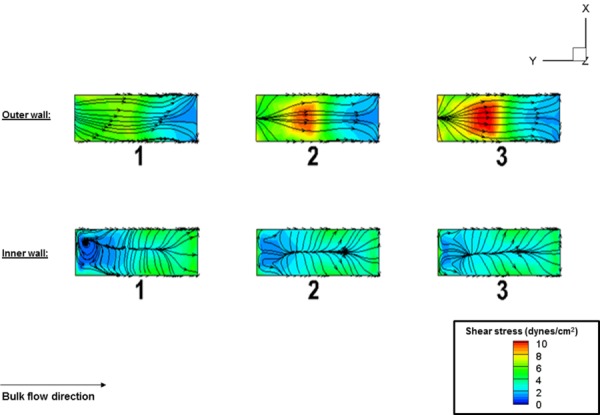
Fig. 8.

Time-averaged specimen shear stress magnitudes and streamlines over one cycle. The following axial locations (Y/D): − 3.5 (specimen 1), −6.34 (specimen 2), −9.2 (specimen 3), corresponding to the center of each specimen, was where the largest magnitude and variation in shear stress magnitude occurred. The outer wall mean shear stress (dynes/cm2) for specimens 1, 2, 3 were 5.5, 7.6, and 7.4, whereas the corresponding inner wall mean shear stress (dynes/cm2) for specimens 1, 2, and 3 were: 2.7, 2.5, and 2.4. These results showed that the average shear stress magnitude was lower for specimen 1 in comparison to specimens 2 and 3 on the outer surface; nonetheless, the difference was comparably small (less than 10%). For the inner wall, the three specimens were subjected to nearly the same value of average shear stress magnitude.
