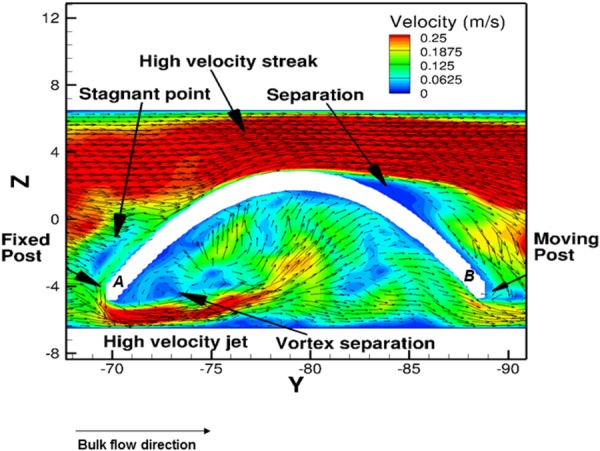
Fig. 9.

Flow patterns around the center specimen for case A (Re = 1376) during one cycle, at the peak flexure state (t = 0.5 s). The velocity vectors were projected on the plane at X = 17.5 mm (i.e., on the centerline of the leaflets). The high velocity streaks were found to be surrounding the sample outer wall, whereas flow vortex formation and reversal occurred proximal to the inner wall, near to the fixed postlocation. The velocity field was considerably lower in the region surrounding the inner wall of the samples. Note that reference positions proximal to the fixed and moving posts have been labeled as A and B in the figure, respectively.
