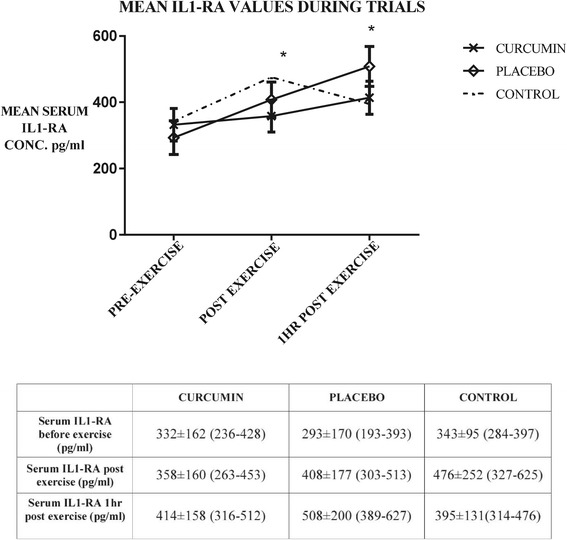
Figure 3.

Mean (±SEM) IL1-RA concentration obtained before exercise, immediately after exercise, and one hour following exercise on each trial day. *indicates significant difference from pre-exercise. Table shows mean cytokine levels, standard deviation, and 95% confidence intervals during trials.
