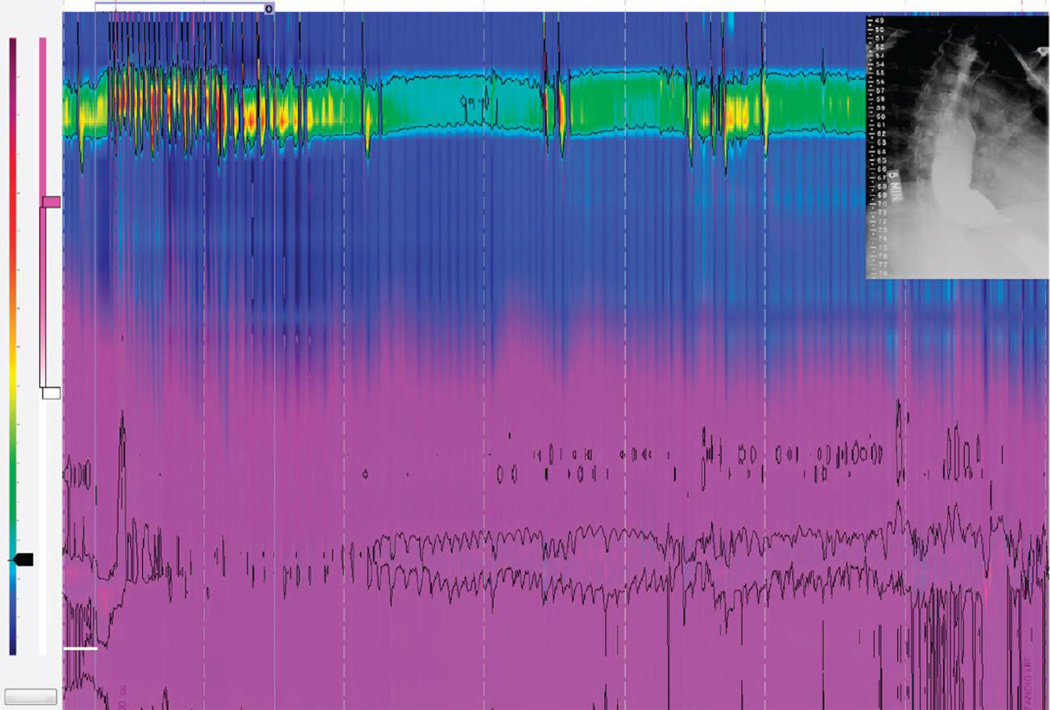
Figure 1.
Methodology and protocol for assessing Impedance Bolus Height (IBH) on HRM with impedance (HRIM) at the 5-minute time-point. The IBH protocol starts with the patient ingesting 200 ml of saline and recording for 5 minutes once the swallow challenge is complete. The height of the bolus retained after a swallow can be visualized using the impedance topography color plot highlighted by the purple color. The impedance range for the impedance topography plot is determined by the nadir impedance value that is calculated as a mean value of the first 3 swallows at the distal esophagus 3 cm above the EGJ. The impedance range is set at the nadir impedance (0.35 kOhms) plus 1000 Ohms to highlight an interface between liquid and mucosa/air. The yellow circles represent measurements of the IBH at 30 second intervals. The timed barium esophagram (TBE) image at 1 and 5 minutes are shown in the same patient to highlight the correlation between TBE and IBH.

