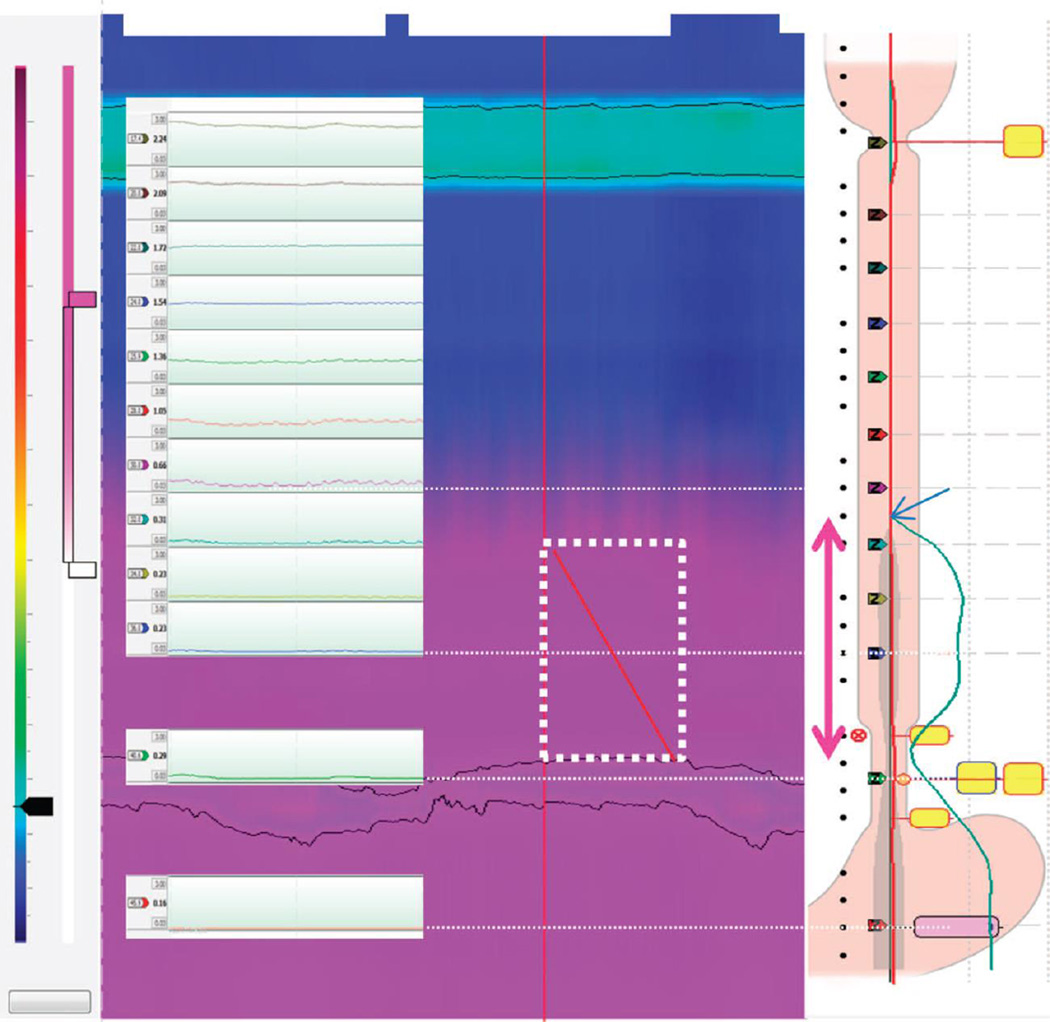
Figure 2.
Techniques utilized for measuring Impedance Bolus Height (IBH). The HRIM catheter is oriented to have impedance recording sites spaced 2 cm apart and positioned through the EGJ and UES. The impedance tracing format is overlaid on top of the HRIM topography plot to illustrate the 2 cm incremental changes in impedance data through the body of the esophagus. The two HRIM impedance techniques utilized to measure the IBH utilize the nadir impedance to highlight the interface using the impedance color topography contour plot (Method 1) and the spatial impedance variation plot (Method 2). The impedance topography method (middle) utilizes a smart mouse tool to measure the distance from the proximal aspect of the EGJ to the top of the topographic color change during end-expiration (white dashed box). In this example, the measurement is 9.0 cm. The spatial impedance variation plot is shown on the right and presents the instantaneous impedance change along the axial length of the esophagus (green line). Interpolation is utilized to smooth out the curve and the range for the impedance measure is set at the nadir impedance to delineate the inflection point where the liquid interface occurs. The IBH is measured by determining the location along the catheter where the nadir impedance inflection occurs to signify the top of the bolus. The height is measured using the catheter sensors as a measurement reference and in this case the height is 9.0 cm.

