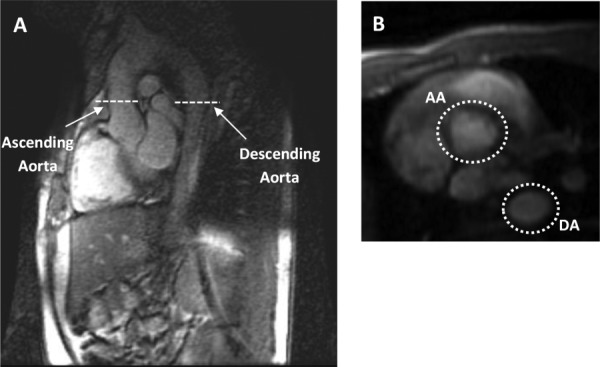
Fig. 6.

Ascending and descending aorta slice locations. Flows in the ascending and descending aorta were measured at rest and during a brief cessation in physical exercise stress. (a) Sagittal image displaying the location of the 2D PC slices that include the ascending and descending aorta. (b) The cross sections of both the AA and DA at rest.
