
Fig. 7.
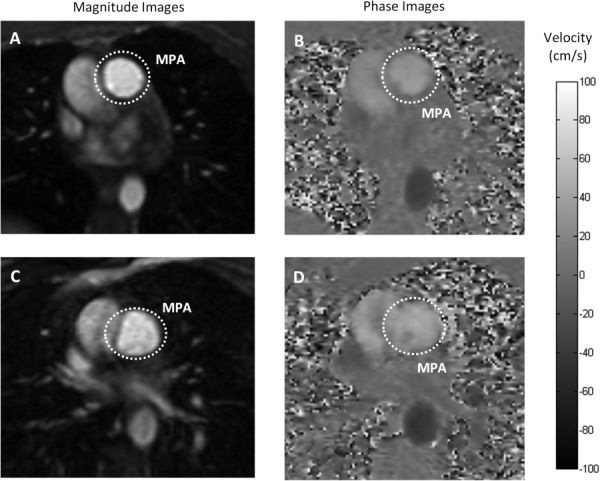
Magnitude and phase MR images of the MPA. Flow in the MPA was measured at rest and during a brief cessation from physical exercise stress from the phase contrast-derived velocity maps integrated over the magnitude-derived area. Grayscale magnitude (a) and phase contrast (b) images of MPA cross section at rest. Grayscale image (c) and phase contrast image (d) of MPA during a brief cessation from physical exercise stress. Both image sets represent peak systole. Color-bar represents flow velocity in the phase images (ranges from −100 cm/s to 100 cm/s) ((b) and (d)).