Fig. 9.

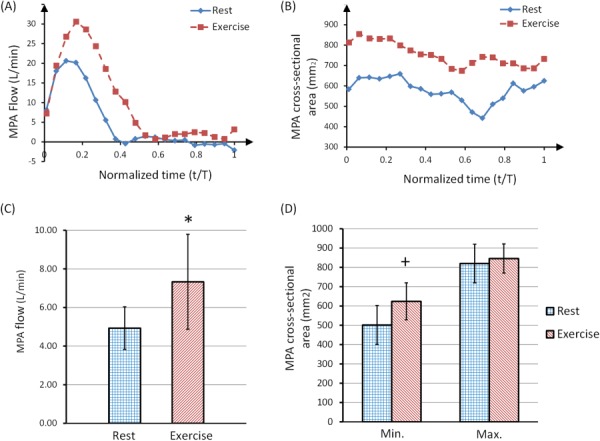
Ensemble-averaged blood flow rate (over 10 heartbeats) in the MPA (a) and cross-sectional area of the MPA (b) of a representative female subject, showing both rest and a brief cessation from exercise stress. The time component was normalized with respect to the total period of the cardiac cycle for each curve. Panel (c) shows the average MPA flow rate of 5 subjects at rest and during brief cessation from exercise (*P < 0.05). Panel (d) shows the minimum and maximum MPA cross-sectional area at rest and during a brief cessation from exercise stress (+P < 0.05).
