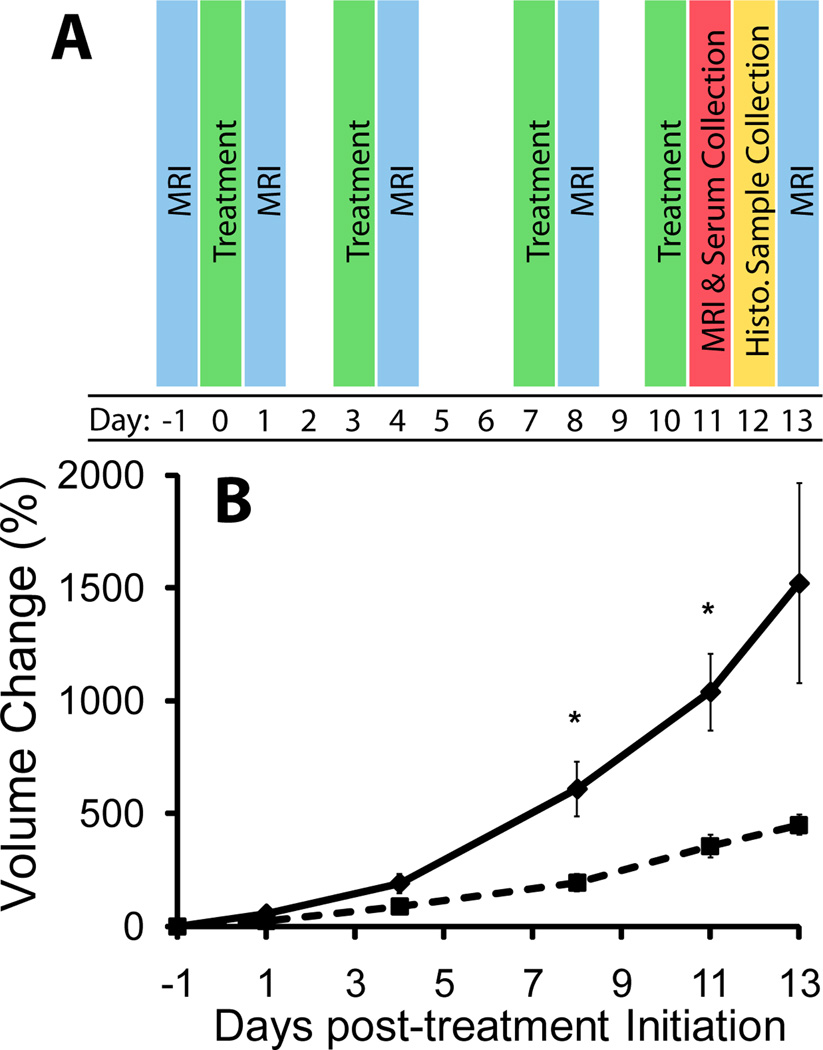
Figure 1.
Diagrammatic presentation of study time points (A). Treatments are highlighted in green, MRI (both DCE and DWI) are highlighted blue, MRI and blood serum collection were performed on day 11 (red), and histological samples were taken at approximately day 12 (yellow). Plot showing relative change in tumor volume in control (diamond, solid line) and treated (square, dotted line) groups over the study time period (B). Treated animals generally showed a significant slowing of tumor growth compared to controls. Doubling times in the control and treated groups were 3.76 (±0.325) and 5.32 (±0.319) days, respectively (p = 0.004). Significance in relative change in volume between groups occurred at days 8 and 11 post-therapy. Data are presented as means ± SEM. Significance was assessed at p<0.05 and indicated by *.

