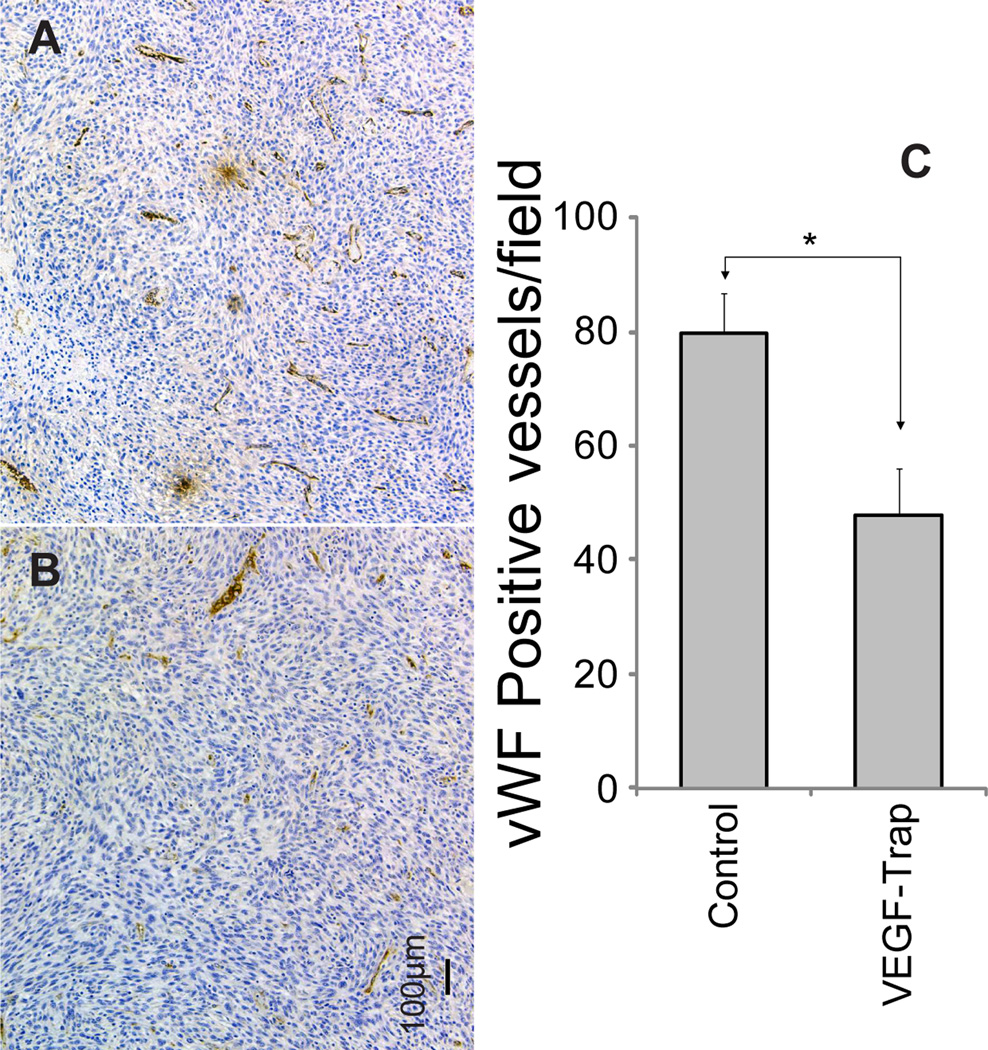
Figure 5.
Tumor vasculature following treatment with vehicle (A) or VEGF-Trap (B) was determined by Von Willebrand factor staining of samples taken on day 12. Positively stained vessels were counted in randomly selected fields. Representative micrographs for each group are shown. The quantification of the vessels for each treatment group in 2–3 randomly selected fields per subject (C). A significant decrease in the number of vessels occurred in VEGF-Trap treated animals (p=0.011). Bar plots are presented as the mean number of nuclei and SEM. Images were acquired at 10× magnification.

