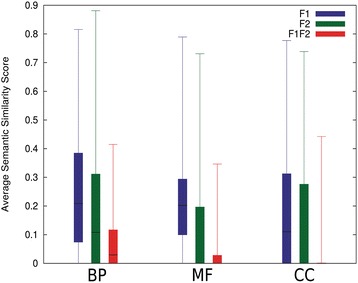
Figure 3.

Average SS Rel distribution. Box-and-whisker plots for average SS Rel distribution of BP, MF, and CC GO pairs for the moonlighting proteins in the MPR1-3 sets excluding proteins with * in Figure 2. The top and the bottom of a box show the first and third quartiles and the line in the middle of a box is the median. The two ends of whisker show the minimum and the maximum values.
