
Figure 4.
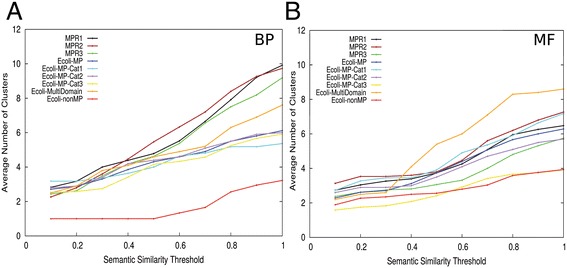
Clustering profiles of sets of moonlighting and non-moonlighting proteins. For each protein in a dataset, GO terms were clustered using various threshold values of SS Rel and average number of GO term clusters were plotted. The datasets plotted were experimentally known moonlighting proteins (MPR1, 2, and 3) and identified moonlighting and non-moonlighting proteins in E. coli (Ecoli-MP and Ecoli-nonMP). E. coli moonlighting proteins were also plotted separately for each evidence category, 1 to 3 (Ecoli-PosMP-Cat1-3; see Methods) as well as multi-domain multi-function proteins. (A) BP GO terms were considered. (B) MF GO terms were considered.