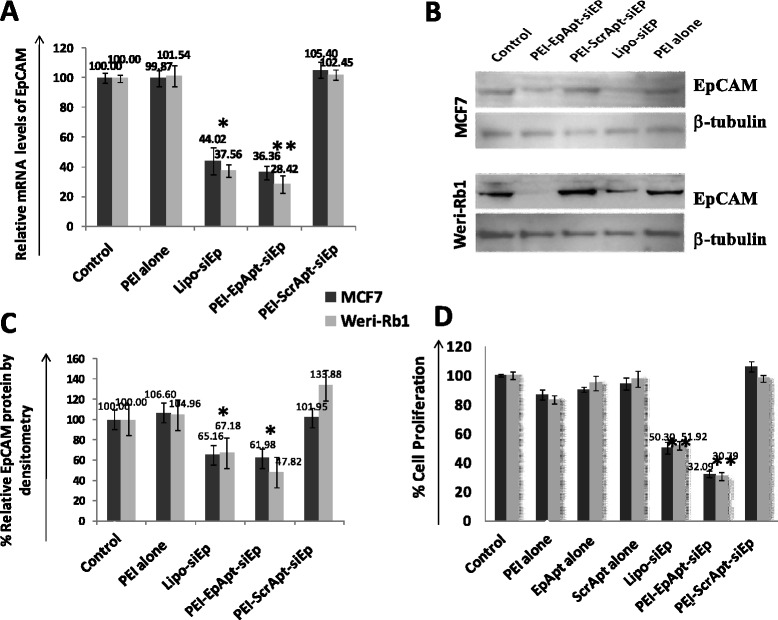
Figure 5.

Expression of EpCAM post silencing using PEI Nanocomplexes. A. qPCR analysis, graph showing the fold change in the EpCAM expression levels, calculated by normalizing with untreated controls and using GAPDH as internal control gene. qPCR was performed post treatment with PEI alone or PEI-Apt-siRNA complexes or silencing using Lipo-siEp. B. Immunoblots were performed for EpCAM and beta-actin to check the silencing efficiency at protein level using EpCAM C-10 primary antibody from Santa Cruz at 1:400 dilution, secondary anti- mouse IgG HRP from Santacruz at 1:1000 dilution. C. Densitometry of the immunoblot normalized with tubulin-internal control and untreated control. D. Cell proliferation was assessed by performing MTT assay. The graph represents the percentage cell proliferation after treatment with the aptamer alone or PEI alone or PEI-Apt-siRNA complexes. Percentage cell proliferation was calculated considering untreated cells as controls in MCF-7 &WERI-Rb1 cell lines.
