
Figure 3.
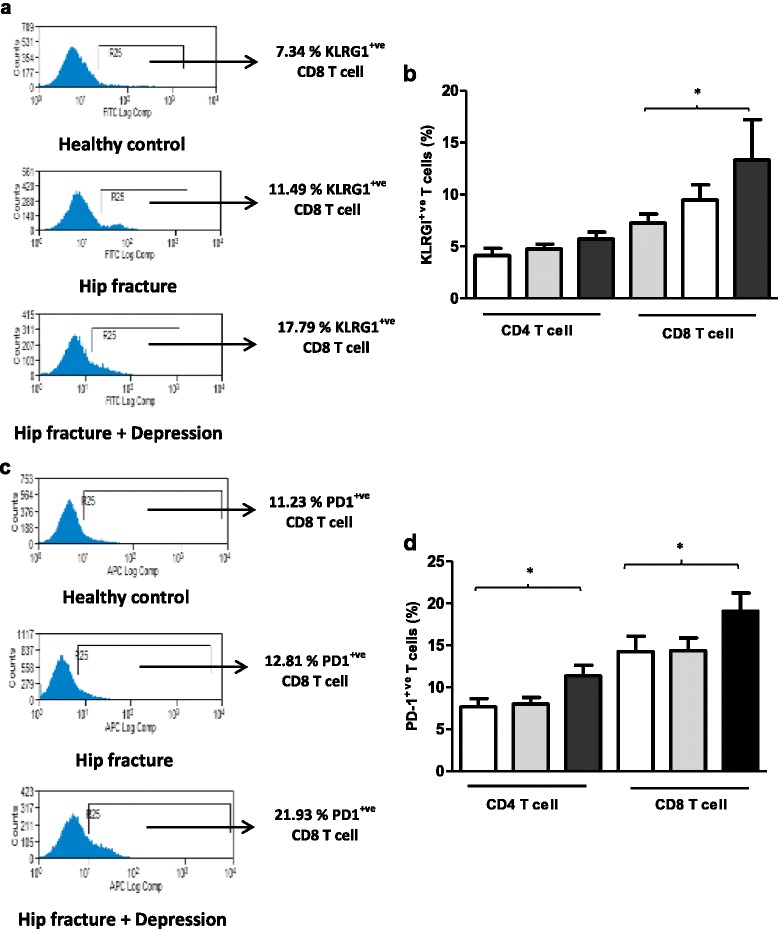
Frequency of peripheral senescent and exhausted T lymphocytes in hip fracture patients with and without depressive symptoms versus healthy controls. (a) Representative flow cytometry plots showing frequency of KLRG1+ve CD8 T cells in a healthy control, hip fracture and a hip fracture patient with depressive symptoms. (b) The percentage of KLRG1+ve CD4 and CD8 T cells in healthy controls: n = 23 (open bars); hip fracture patients without depression n = 19 (grey bars); and hip fracture patients with depressive symptoms n = 23 (black bars). (c) Representative flow cytometry plots showing frequency of PD1+ve CD8 T cells in a healthy control, hip fracture and a hip fracture patient with depressive symptoms. (d) The percentage of PD1+ve CD4 and CD8 T cells in healthy controls: n = 23 (open bars); hip fracture patients without depression n = 19 (grey bars); and hip fracture patients with depressive symptoms n = 23 (black bars). Data are mean ± SEM. *p < .05 and **p < .01.