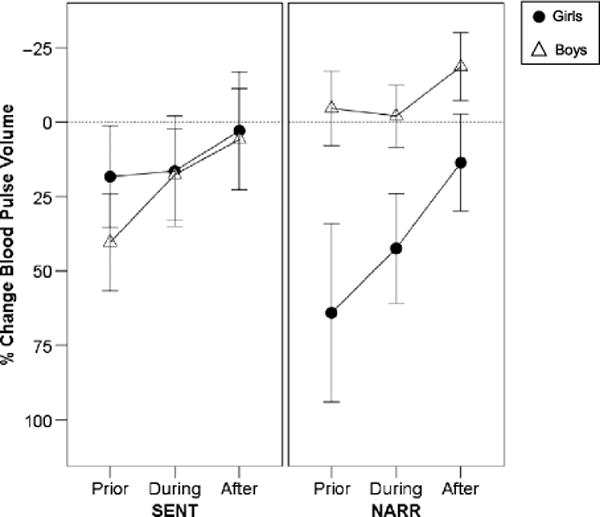
Figure 4.

Means and standard error bars for autonomic responses for intervals prior to, during, and after each of the experimental tasks are plotted for girls and boys. Percentage change in BPV (from baseline) is plotted with negative percentages going upward so that increased arousal is plotted by higher points on the graphs.
