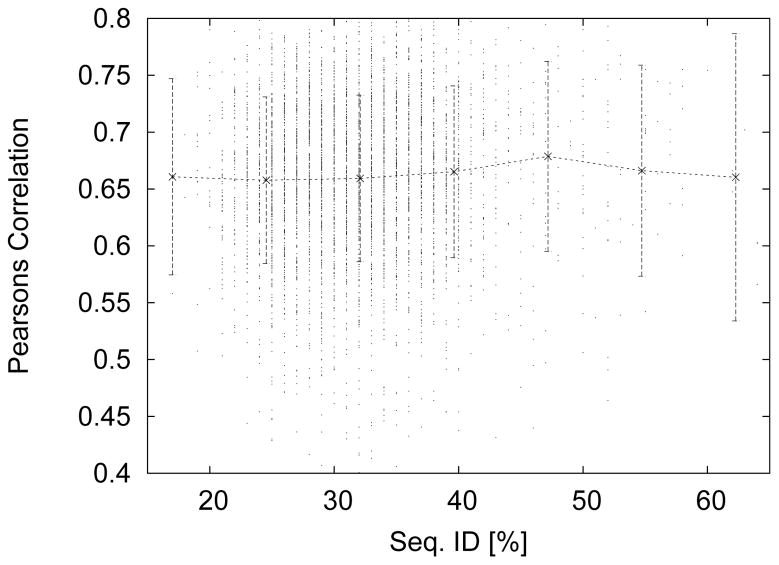
Figure 3.
Prediction correlation versus the maximum sequence similarity between 5000 test proteins and 9361 training/over-fit proteins. The correlation of this data is 0.086 showing that our sequence only approach exhibits applies equally to similar and dissimilar proteins. The solid line and error bars give the binned averages and standard deviations.

