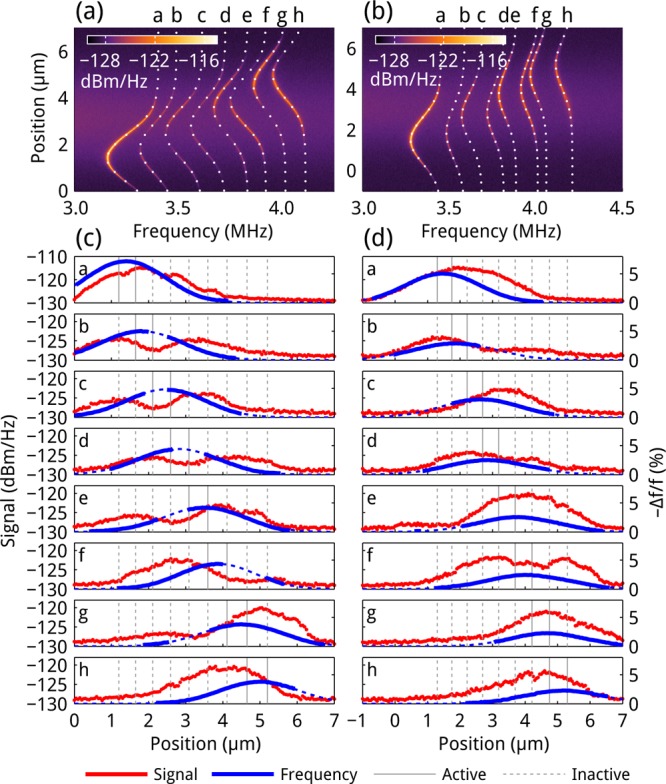
Figure 4.

Mechanical resonance intensities. (a) Line scan across the center of an array of eight nanobeams separated by a fixed width of 20 nm. The peak resonance frequency is plotted on the horizontal axis, and the resonance peak intensity is represented by the color scale. Dots indicate Gaussian fits to peak frequencies as a function of the laser focus position on the array. (b) Similar to (a), for an array with beams alternately separated by 20 and 50 nm. (c) Transduction curves extracted from (a): the resonance peak intensities are shown as a function of laser spot position (red dots), along with the peak resonance frequencies (blue line). A dashed line indicates that the signal was too low to extract for use in fitting. The gray vertical lines indicate the positions of the slits, with the solid lines indicating the slits next to the beam for which the transduction is plotted. (d) Transduction curves extracted from (b). The focal diameters, 2.48 ± 0.06 μm fwhm for (a) and 2.84 ± 0.13 μm for (b), were determined from the average width of the Gaussian fits. Laser power detected was 11.5 μW (a, c) and 10.5 μW (b, d).
