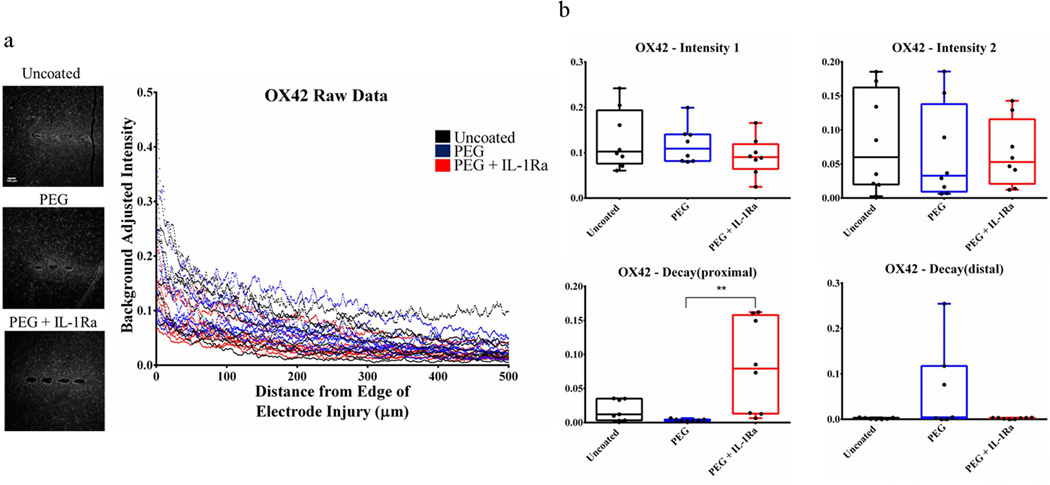
Figure 5.
Immunofluorescence analysis for resident microglia (OX42). (a) Immunofluorescence images (left) and corresponding intensity profile (right) for uncoated, PEG, and PEG+IL-1Ra (n=8 per group). (b) Parameter plots indicate differences in each parameter of Equation 1 for each experimental group. The Decayproximal parameter is significantly higher for PEG+IL-1Ra compared to PEG alone. The box plots indicate minimum, 25th percentile, median, 75th percentile, and maximum, with individual points shown for each sample. ** = p<0.01.

