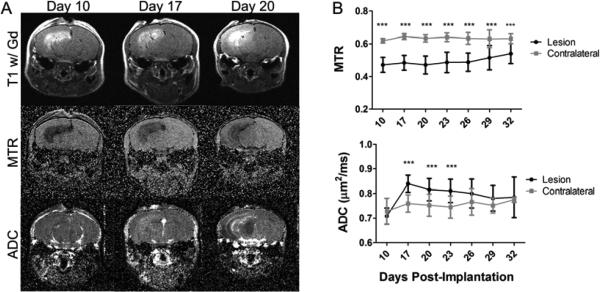
Figure 4.
MTR is consistently lower, while ADC is transiently increased in the irradiated glioma model. Panel A presents the post-contrast T1-weighted images (top), MTR maps (middle), and ADC maps (bottom) of a representative mouse at PImD 10 (left), 17 (center), and final (right). The lesion is bright on post-contrast T1. Panel B presents the group average MTR (top) and ADC (bottom) for the lesion and contralateral ROIs at all time points measured (mean ± SD, N=10). *** indicates P<0.001 as measured by Two-Way Repeated-Measures ANOVA with a Bonferroni post-test.

