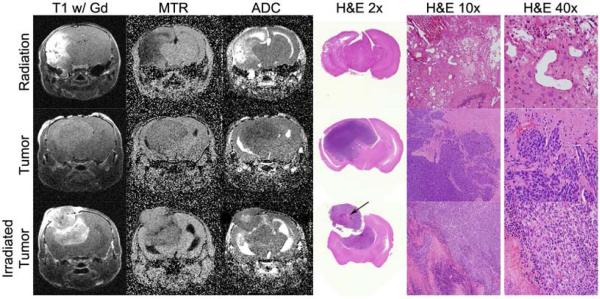
Figure 5.
Histology compared to the MRI metrics at the final time point. The top row presents a radiation injury example, the middle row presents an untreated glioma example, and the bottom row presents an irradiated glioma example. From left to right, columns show T1-weighted images, MTR maps, and ADC maps of the same slice followed by H&E-stained tissue slices at a comparable anatomical location at 2x, 10x and 40x magnification. The data shown in this figure are for different animals than those of Figures 1, 2, and 4. Of note, the H&E of the irradiated tumor confirms that there is a necrotic section within the tumor (arrow), consistent with the corresponding ADC map.

