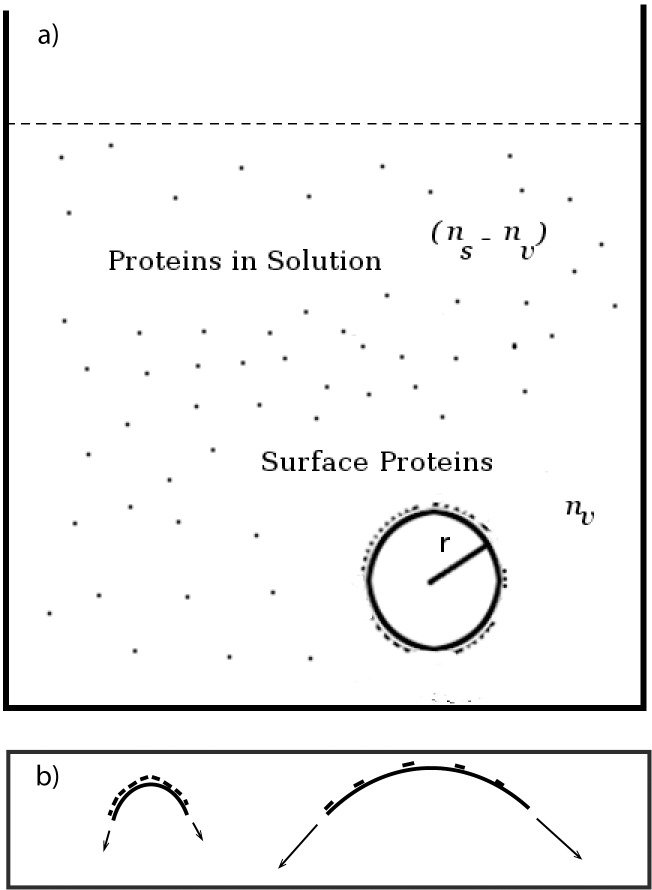
Figure 2. Schematic of spherical vesicle in protein solution.
a) Schematic depiction of vesicle of radius r in bath of SpoVM molecules; n s is the total number of VM molecules in solution and n v is the total number of VM molecules on the surface of the vesicle. b) Two vesicles of different radii with a higher concentration of VM molecules on the surface of the larger vesicle. We suggest in the paper that the larger vesicle also has a higher membrane tension and that SpoVM is detecting membrane tension rather than curvature directly in the in-vitro experiments.

