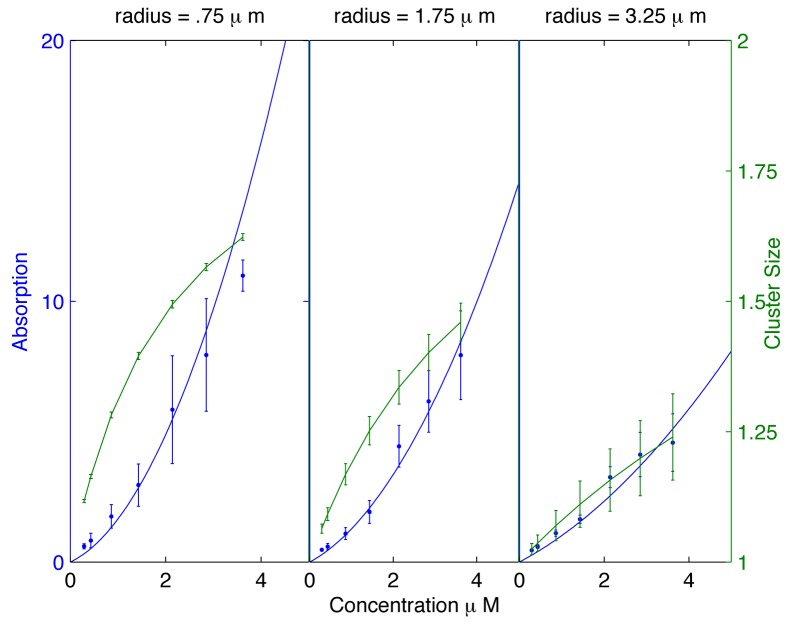
Figure 4. Membrane adsorption as a function of SpoVM concentration.
We plot membrane adsorption (solid curve) and average cluster size (dashed curve) versus SpoVM concentration in solution using e r = (0.7 + 0.6r)k B T, for vesicle radii r = .75, r = 1.75, and r = 3.25 μm. Based on experimental error bars, we have incorporated the appropriate error bars in the plots of cluster size, noting that cluster size is indicative of the degree of cooperativity in SpoVM adsorption. While still significant, the error bars are small enough to indicate relatively small cluster sizes with confidence.

