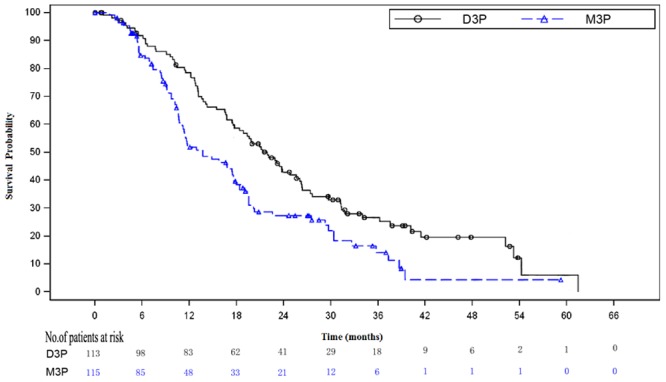
Figure 2. Kaplan-Meier curve for overall survival by different treatment arms in the intention to treat analysis.

The Kaplan-Meier curve for D3P arm was above the curve for M3P arm, log-rank analysis proved this difference was statistically significant (P = 0.0011, HR = 0.63, 95% CI [0.46–0.86]). D3P = docetaxel plus prednisone arm. M3P = mitoxantrone plus prednisone arm.
