
Figure 11.
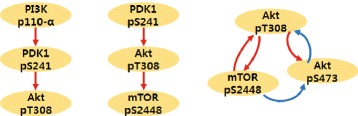
HER2+ overexpressed breast cancer. CS reconstruction result using Reverse Phase Protein Array data (SKBR 3 cell line, Serum [32]). See Additional file 1: Figure S1, S2 and S3 for further details (red: activation, blue: inhibition). Here, we choose small networks which are composed of 3 nodes and known to be sparsely connected in order to satisfy our assumption such that the influence on observable nodes from a hidden node should be sparse. The identified graph structures are consistent with the current understanding of the networks.