
Figure 12.
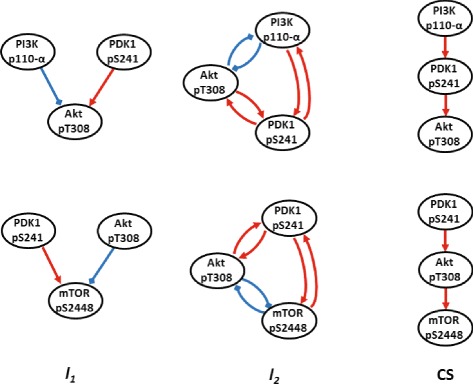
Sub networks inferred for the HER2/3 signaling network from Reverse Phase Protein Array data. The columns show the networks inferred by L1-optimization, L2-optimization, and CS. The network structures identified by CS agree with the current understanding of the network, whereas those found using L1 and L2 optimization do not. See Additional file 1: Figure S1, S2 and S3 for further details (red: activation, blue: inhibition).