
Figure 2.
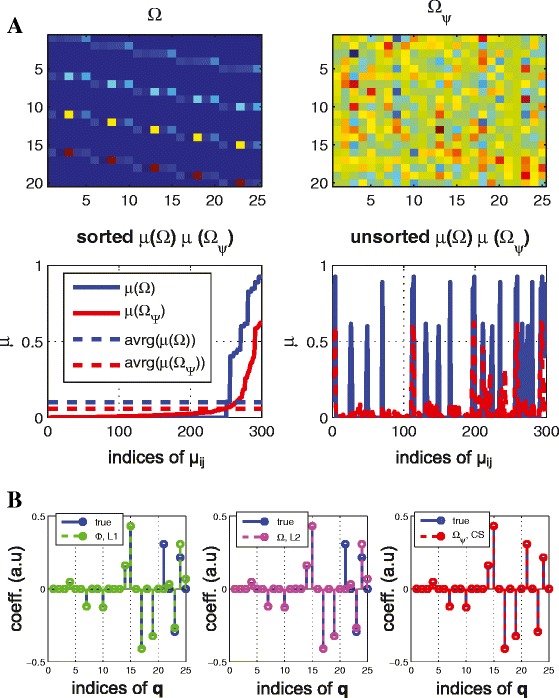
Reducing coherence for a linear system. (Example 2) (A) the sensing matrix , without (top left) and with transformation Ψ (top right) and the corresponding coherence distribution (bottom) (B) reconstruction result (left) L1 (middle) L2 with Ω (right) l 1 optimization with Ω Ψ (CS) where x-axis represents indices of and y-axis represents coefficient of q (a.u). By reducing coherence of the sensing matrix with transformation, we can recover the exact structure in (B) (right). However, both L1 and L2 fail to recover the exact structure.