
Figure 3.
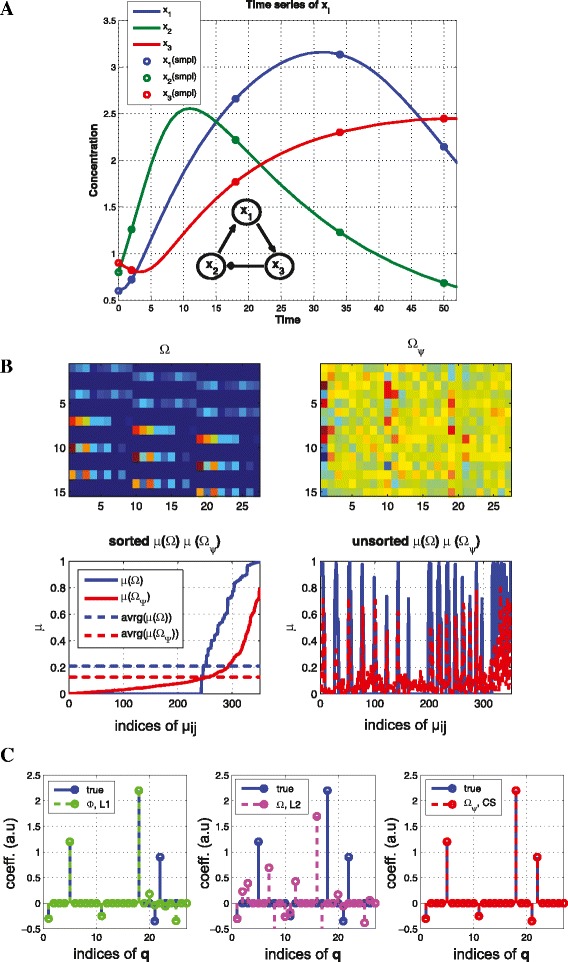
Reducing coherence for a nonlinear system. (Example 3) (A) Time series of x 1, x 2, x 3 for model in Equation (15) (B) the sensing matrix without (top left) and with transformation Ψ matrix (top right) and the corresponding coherence distribution (bottom) (C) reconstruction results. By constructing the sensing matrix where n=3,N=9,M=5 and s=6, we recover the s-sparse signal in (B) (right). However, both L1 and L2 fail to recover the exact structure q.