
Figure 6.
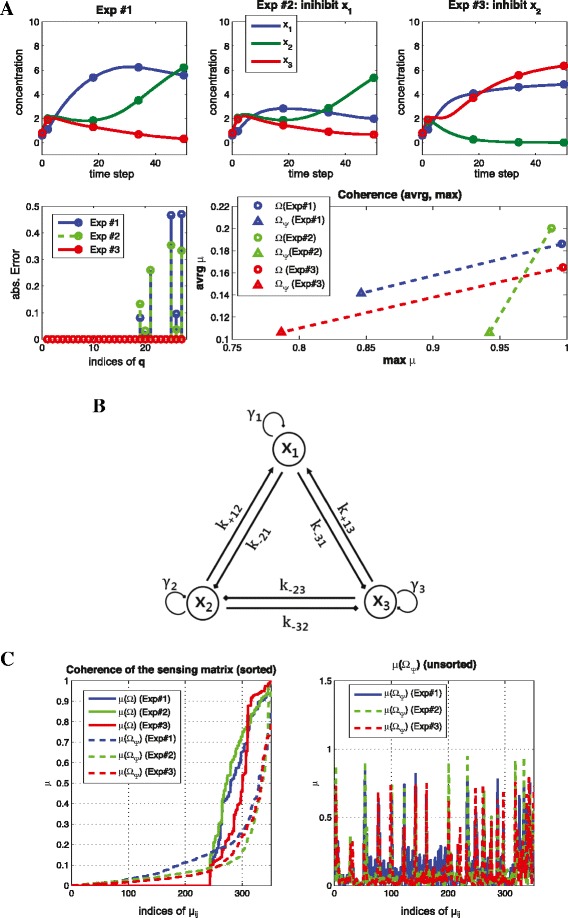
Design effective experiment for a nonlinear system. (Example 5) Reconstruction result based on different experiment (nonlinear case): Exp#1 represents the original experimental dataset which has limitation to reduce coherence; Exp#2 represents non-effective experimental dataset (inhibit x 1); and Exp#3 represents the effective experimental dataset (inhibit x 2) (A) the time series of x 1, x 2, x 3 for each experiment (top), the reconstruction error (bottom left) and coherence comparison for each experiment (bottom right) (B) the corresponding topology (C) coherence distribution of the sensing matrix. In Exp#3, we reduce the coherence below 0.8.