
Figure 7.
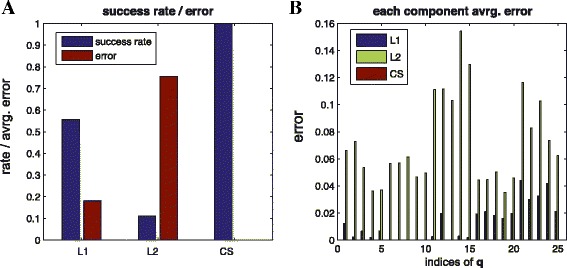
Comparison L 1, L 2, and CS . (Example 6, linear case) statistics of success rate and error among 50 trials: (A) success rate (blue bar) and reconstruction error (red bar) (B) component-wise reconstruction error. By reducing coherence, we can improve the success rate as shown in Figure 7 (A). Also, since L2-regularization does not encourage sparsity but distributes the coefficients to be more similar to each other, component-wise errors are distributed as shown in (B).