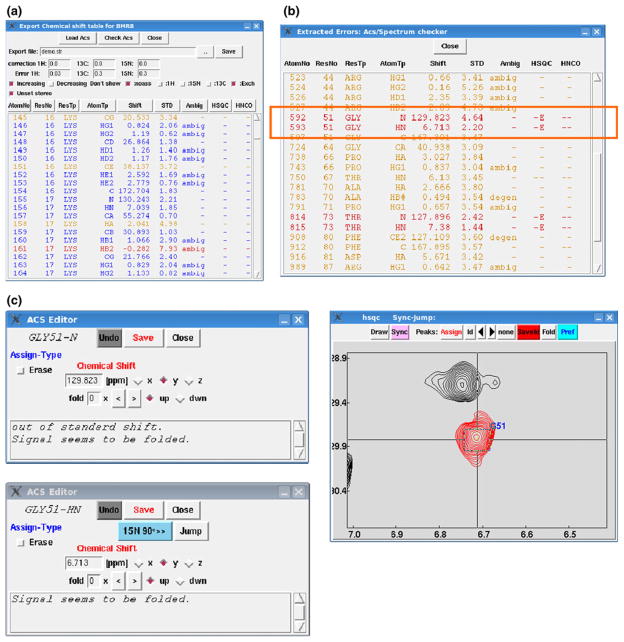
Fig. 3.
Graphical interface (a) of “Export chemical shift table for BMRB” popped up by clicking the button “Chemical shift” in the BMRB format editor shown in the figure. The editor can load chemical shifts for all atoms listed in the targeted NMR data by pressing the button “Load Acs” on the header of the GUI. The function can also indicate outliers evaluated by comparison with the standard chemical shifts listed in BMRB statistics with different colors. If the value (σ: assigned chemical shift and μ: standard value for the corresponding atom) is three or six times greater than the standard deviation listed in the statistics, the color is set at orange or red, respectively. The systematic corrections for the chemical shifts for 1H, 13C and 15N signals loaded on the listbox can be applied with the values (ppm) as specified in the “correction” entries. The error values for the signals are also specified in the entries as indicated “Error”. The check-boxes indicated as “Don’t show” for “noass”, “1H, 13C and 15N” and “Exch” are filtering the signals not assigned, assigned and exchangeable, respectively. The check-box labeled with “Unset stereo” switches all of the stereo-specific assignments for prochiral atoms treated as ambiguous ones. The buttons aligned just above the list-box are used for sorting elements displayed in the list-box, each of which corresponds to the column item. The sorting direction can be specified with check-box indicated as “Increasing” and “Decreasing”, with the manner of integer, floating point and alphabetical depending on the type of column items. b By pressing the button “Check Acs”, the sub-window pops up as shown. The function requires 2D 1H–15N, 1H–13C aliphatic and aromatic HSQC and 3D HNCO spectra. The list-box emphasizes the signals that have been considered to be outliers as mentioned above. The signals are also highlighted by red whose detected intensity is below 1.5 times the specified threshold for displaying the 2D contour plots in the corresponding position of the spectra. The lines indicated by a red box show that the 15N signal of Gly is suspected to be assigned on the aliased position inferred from the chemical shift and sign of the signal. Double-clicking the line pops up an editor sub-window for the assignment as shown in c with assessed comments. The sub-window for 1HN signal has a Jump button to display the corresponding region of the spectrum

