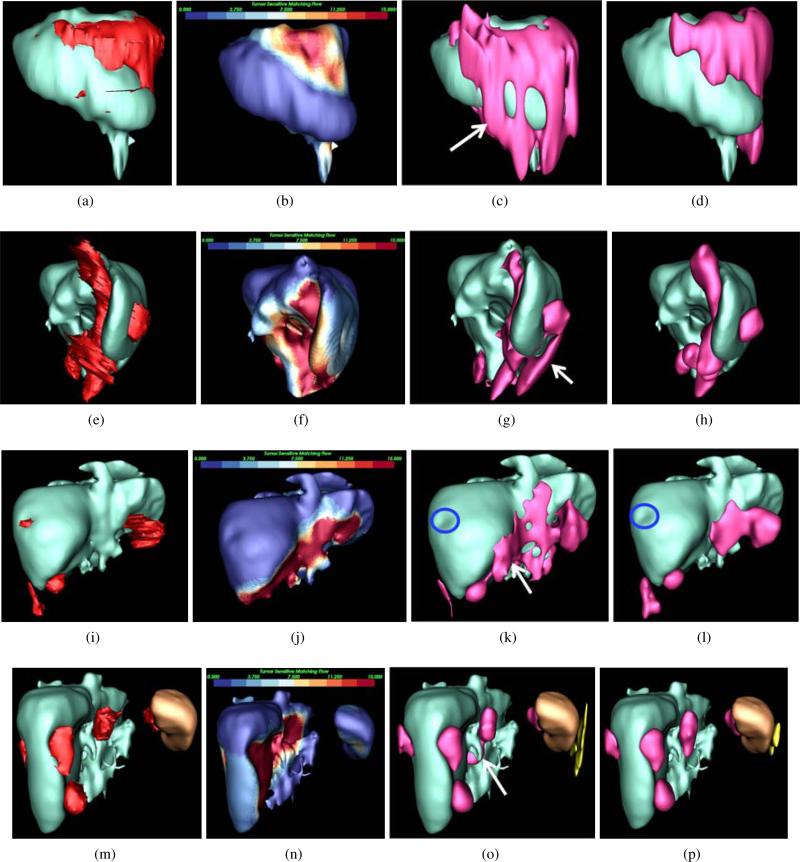
Figure 14.
Comparison of metastasis segmentation using GAC and TSMF-constrained GAC, where livers are visualized in cyan, metastases in red, spleen in brown and false positives in yellow. Metastasis ground-truths were given in the first column, and TSMF results were in the second column. Metastasis segmentations using GAC and TSMF-constrained GAC were shown in the third and fourth columns. Each row corresponds to a patient. The first patient at the top row was scanned with 5mm slice thickness. GAC caused metastasis over-segmentation (white arrow in (c)). Thanks to TSMF accurately detecting metastasis shapes in (b), the over-segmentation was relieved in (d). Metastasis clustering was observed in (e), and TSMF detected all these metastases. TSMF-constrained GAC also addressed over-segmentation (white arrow in (g)) generated by GAC. Although one metastasis less than 10mm in size (blue circles) was missed in the third patient, TSMF successfully detected all other metastases and TSMF-constrained GAC also reduced metastasis over-segmentation (white arrow in (k)). In the last patient, TSMF identified metastases adherent to both spleen and liver with one false positive on the spleen. TSMF-constrained GAC was again superior to GAC in dealing with over-segmentation (white arrow in (o)).

