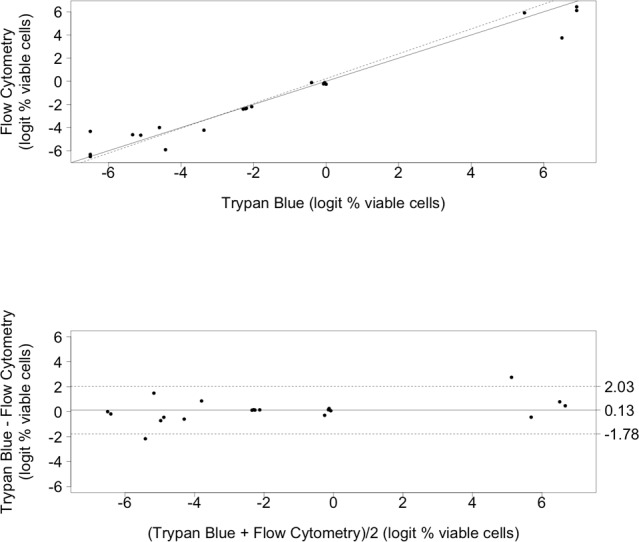
Figure 4. Percentage Viable Cells by Trypan Blue Staining versus Flow Cytometry.

From prepared samples of 100:0, 50:50, 10:90, 1:99, 0:100 live:dead cryptococci. 4A (top). Scatter plot for Trypan Blue and Flow Cytometry methods of measuring viable cell percentages. Solid line indicates the reference line. Dotted line indicates the regression line. 4B (bottom). Bland-Altman difference plot comparing the Trypan Blue and Flow Cytometry viable cell measurement methods. The bias (mean difference between measurement methods) is shown as a solid horizontal line and the 95% limits of agreement are shown with dashed lines at +/− 1.96 standard deviations.
