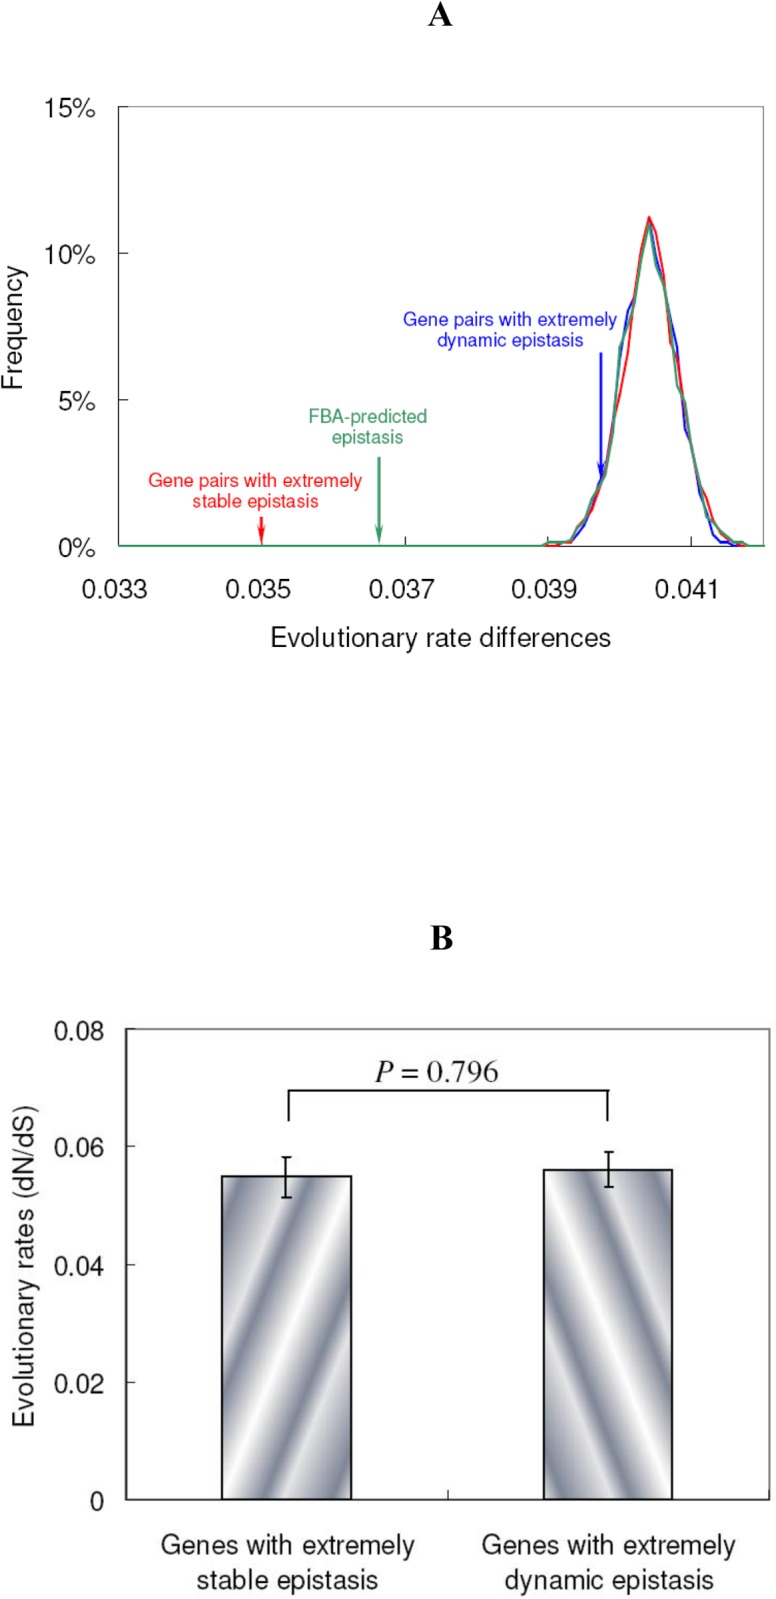
Figure 5. Co-evolution between genes with epistasis.

(A) Average evolutionary rate differences between gene pairs with FBA-predicted epistasis (green), extremely dynamic epistasis (blue) and extremely stable epistasis (red) are highlighted by three arrows, respectively. The random simulations with the same number of gene pairs as each of the three groups were repeated 10,000 times and the frequency distributions are shown (marked by the same colors as the corresponding arrows, respectively). (B) The evolutionary rates for genes that are involved in extremely stable and extremely dynamic epistasis, respectively. The error bars represent standard errors.
