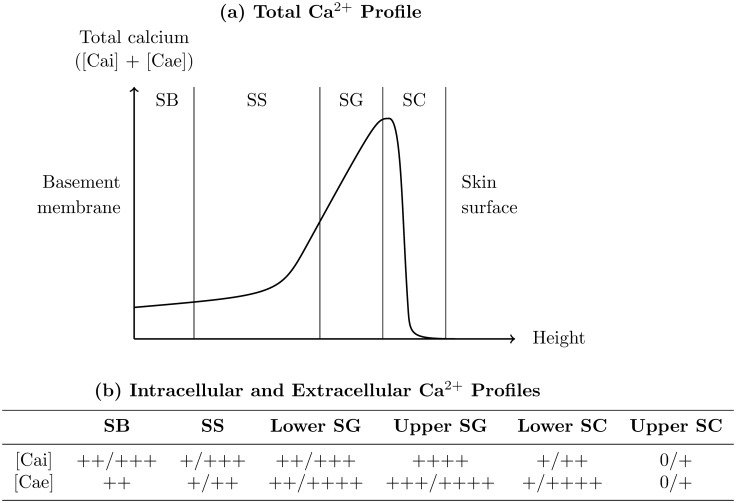
Figure 1. The epidermal calcium distribution.
(a) Typical shape of the total profile found quantitatively using PIXE (for examples in the experimental literature, see [26, 28]). (b) Typical shape of the semi-quantitative intracellular ([Cai]) and extracellular ([Cae]) profiles measured using ion capture cytochemistry (for examples in the experimental literature, see [32–34]).

