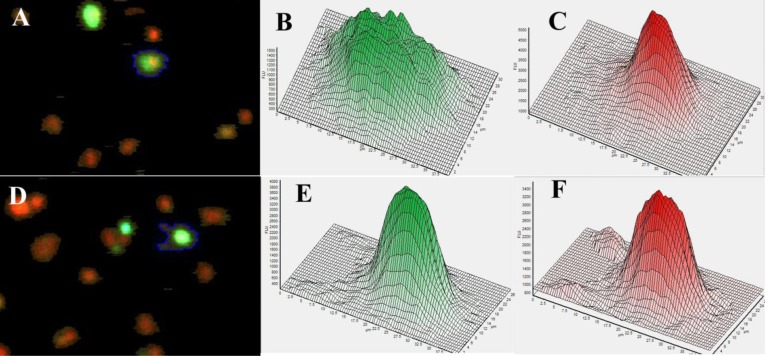
Figure 1. HEK293 cells transfected with p21cip1. Image of cells acquired from the Acumen cytometer.
The p21cip1 was labelled by immunohistochemistry (green fluorescence). The DNA is labelled red by the PI. Panel A: The cell with the blue edge is an example of what we would accept as cytoplasmic protein expression. Panel B is the green fluorescence intensity histogram (as measured by the cytometer) over the surface of the same cell (with the blue edge in panel A) indicating a relatively uniform protein distribution in the cytoplasm around the nucleus. Panel C is the distribution histogram of the red fluorescence (DNA) from the same cell (with the blue edge in panel A). The distribution of the DNA is characteristic for a single cell. Panel D: The cell with the blue edge is an example of what we would accept as nuclear protein expression. Panel E is the green fluorescence intensity histogram (protein content as measured by the cytometer) over the surface of the same cell (with the blue edge in panel D). Panel F is the red fluorescence (DNA) from the same cell (with the blue edge in panel D). The overlap and identical distribution patterns of the protein (green label) and DNA (red label) is characteristic for nuclear proteins.

