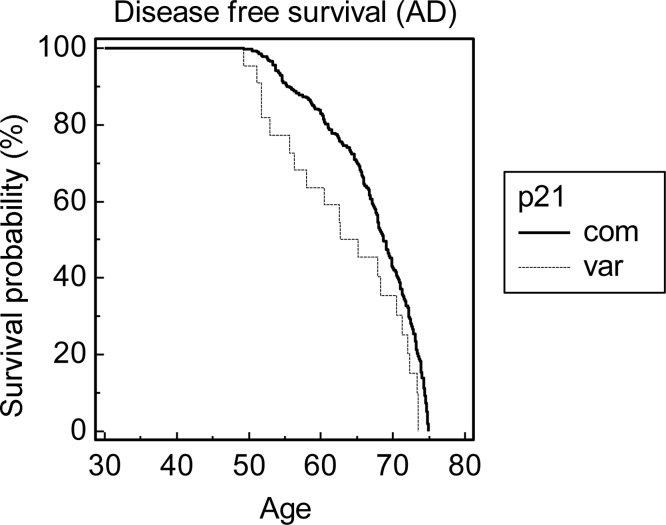
Figure 2. Kaplan-Meier probability distribution of disease free survival prior to the age of 75.
The disease in question was dementia associated with AD. The graph shows the disease free survival probability of subjects prior to the age of 75, in subgroups defined by the p21cip1 genotype. Prior to the age of 75, the variant p21cip1 was associated with a significant reduction in the disease free survival compared to the common p21cip1 (hazard ratio: 1.698, p-value: 0.017). The x-axis represents the age in years. The y-axis represents the survival probability expressed as a percentage. The solid black line represents subjects that were homozygous for the common p21cip1. The broken grey line represents subjects that were heterozygous or homozygous for the variant p21cip1.

