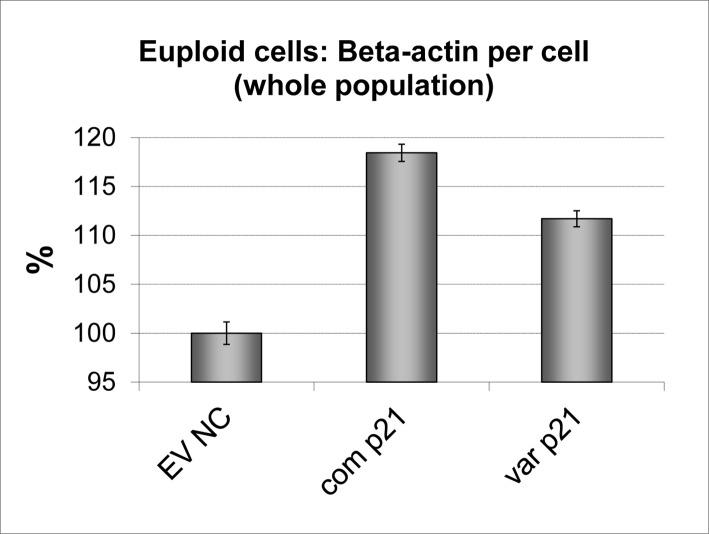
Figure 11. The effect of the p21cip1 genotype on beta-actin expression.
The graph shows the amount of beta-actin detected per cell expressed as a percentage change relative to the empty vector negative control. Beta-actin expression was determined by Acumen Cytometry with beta-actin immunostaining: with the total amount of beta-actin detected divided by the total number of cells in the sample. The cells were not double stained for p21cip1 protein, so we were unable to differentiate the p21cip1 positive population (transfected cells) from the p21cip1 negative population (non-transfected cells). X-axis: EV NC: Empty vector negative control; com p21: cells transfected with common p21cip1; var p21: cells transfected with variant p21cip1. The y-axis represents the percentage change in beta-actin expression per cell relative to the EV NC. The top of the bars represent the mean. The error bars represent the SEM.

