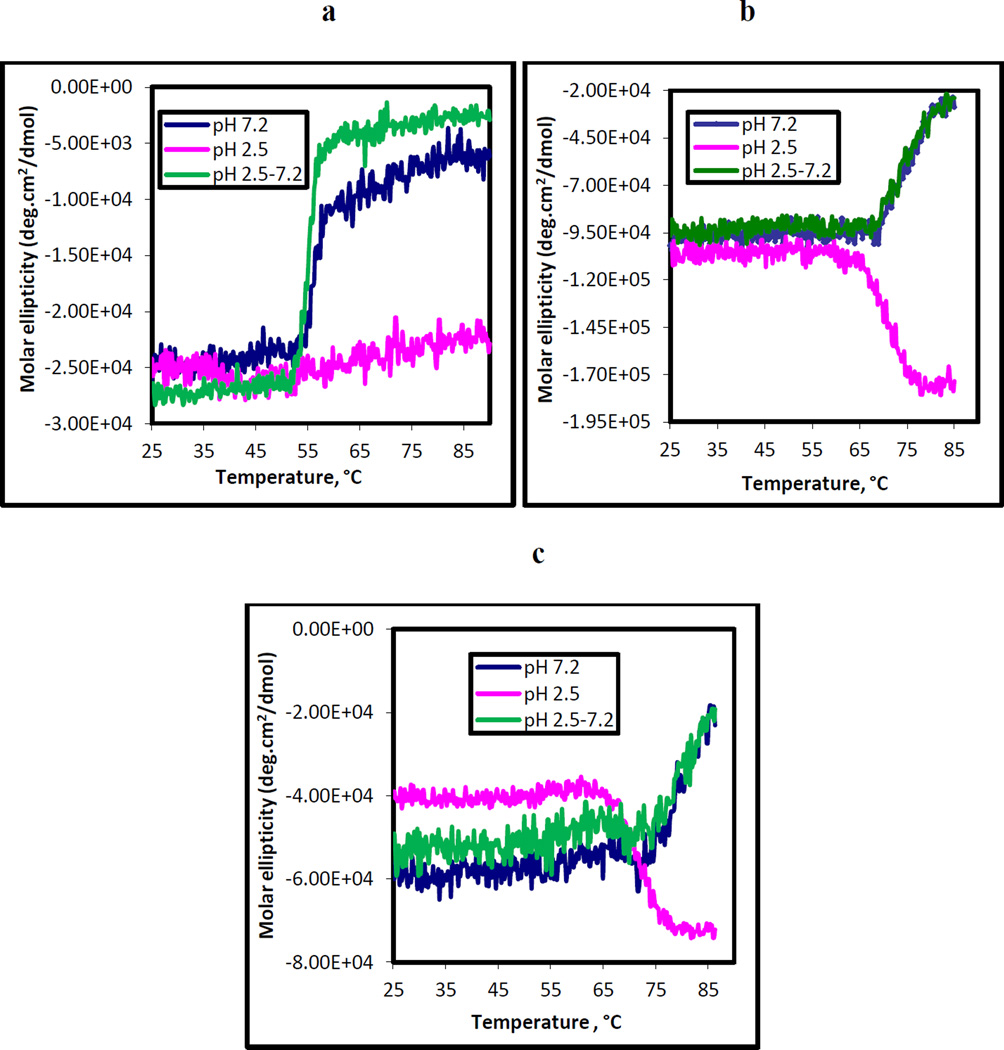
Figure 2.
Thermal unfolding pattern of BoNT/A proteins- (a) purified BoNT/A (b) BoNT/A complex and (c) NAPs complex measured at three different pH conditions by monitoring the ellipticity at 222 nm. The protein buffers used for spectral recordings were 10 mM sodium phosphate and 50 mM NaCl, pH 7.2 and 10 mM citrate-phosphate buffer and 50 mM NaCl, pH 2.5. The spectrum is an average of three spectral scans in the temperature range of 25 °C − 90° C. The rate of heating was 2° C/min and the response time was 8 s.

