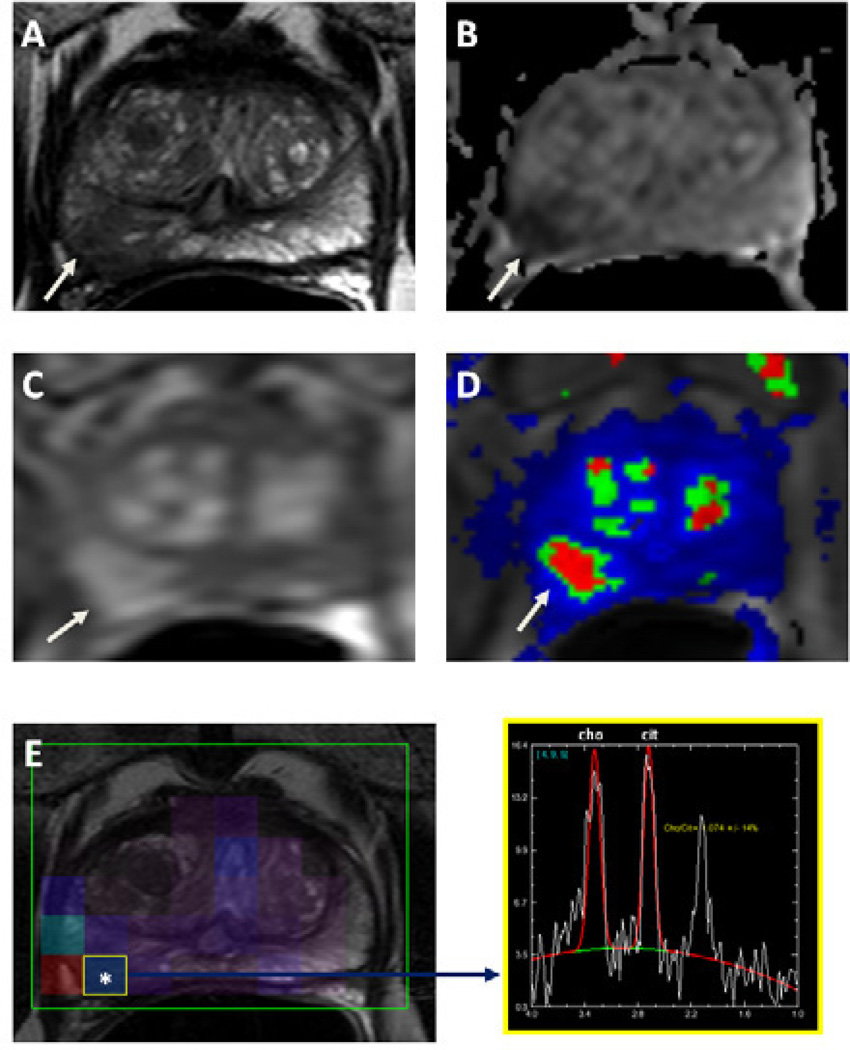
Figure 6.
MRI of the prostate in a 63-year-old male with prostate cancer. Axial T2W image demonstrates a right sided low signal intensity lesion at the peripheral zone (arrow) (a), the lesion demonstrates diffusion restriction on corresponding apparent diffusion coefficient map of DWI MRI (b) (arrow); lesion shows increased enhancement on axial T1W DCE-MR image, whereas color coded kep map delineates the lesion (arrow) (d). MR spectroscopy demonstrates increased choline to citrate ratio within the right peripheral zone lesion (e). This lesion was biopsied under TRUS/MRI fusion system guidance and was found to include Gleason 8 (4+4) tumor.

