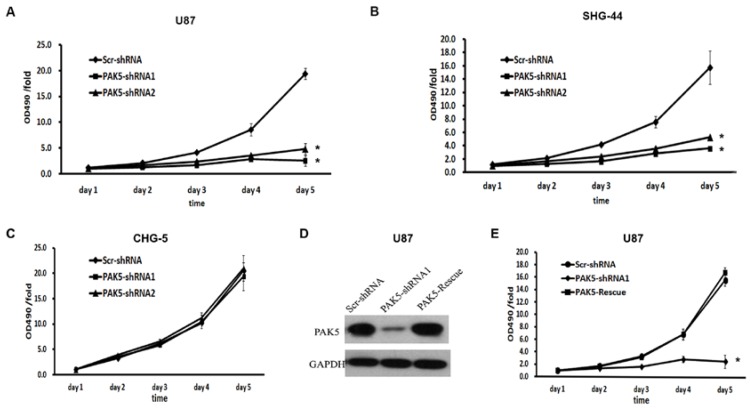
Figure 3.
Inhibition of PAK5 remarkably suppresses cell viability in glioma cells with high PAK5 expression. (A-C) Cell viability curves of U87 (A), SHG-44 (B) and CHG-5 (C) cells during the 5 days were evaluated by the MTT assay. The data represent the mean ± SEM of three independent experiments. *, P < 0.05 vs. cells infected with Scr-shRNA lentivirus. (D) PAK5 protein expression in U87 cells infected with a vector with expressing PAK5 after PAK5-shRNA1-mediated PAK5 knockdown. (E) Cell viability curves of U87 cells of three groups during the 5 days were evaluated by the MTT assay. The data represent the mean ± SEM of three independent experiments. *, P < 0.05 vs. cells infected with Scr-shRNA lentivirus.

