Fig. 3.
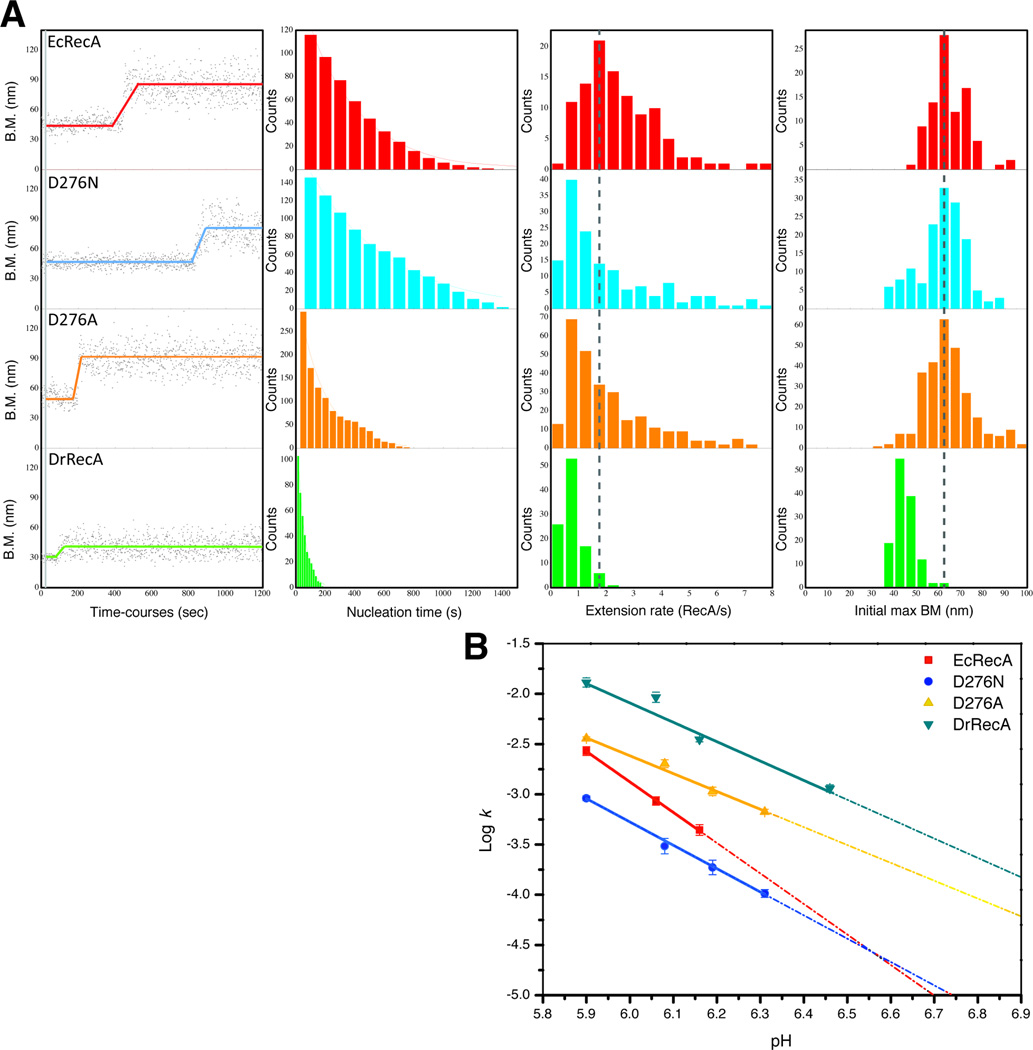
Single-molecule TPM observation of the nucleoprotein filament assembly process of EcRecA, D276N mutant, D276A mutant and DrRecA on dsDNA. (A). Exemplary time-courses of the filament assembly process on 382 bp dsDNA at pH 6.20. The RecA mixture was flowed in during the time represented by the short vertical gray bar at the beginning of each reacion. Before RecA forms a stable nucleus, the BM amplitude stays constant, the same as that before the gray bar. A stable nucleus is followed by a cooperative extension process, which is represented by the continuous BM increase. After the filament assembly is finished, the BM amplitude reaches a maximum plateau value. In the subsequent three columns are the accumulated histograms of observed nucleation times (the point in each trial in which BM begins to increase), observed extension rates, and observed maximum BM amplitudes. The histograms include 116, 146, 293, and 103 individual observed filaments of EcRecA, D276N, D276A and DrRecA, respectively. (B) pH-rate profiles for the measured nucleation rates for the proteins listed.

