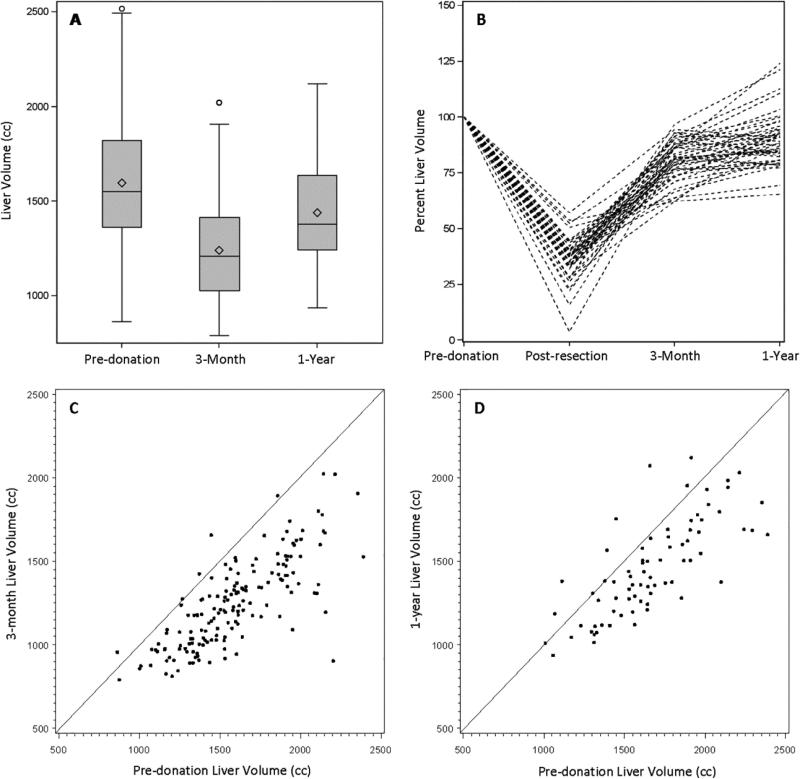
Figure 2.
Liver volumes pre-donation, post-resection (panel B only), and post-donation at 3 months and 1 year. Volumes are shown as (A) box plots by time point (pre-donation: N=346, 3-month: N=182, 1-year: N=90), (B) a spaghetti plot showing volumes over time as a percent of pre-donation volumes for donors with complete data at all 4 time points (N=46), and as scatter plots of (C) 3 month volume (N=165) and (D) 1 year volume (N=75) plotted against pre-donation volumes, with a diagonal identity line.

