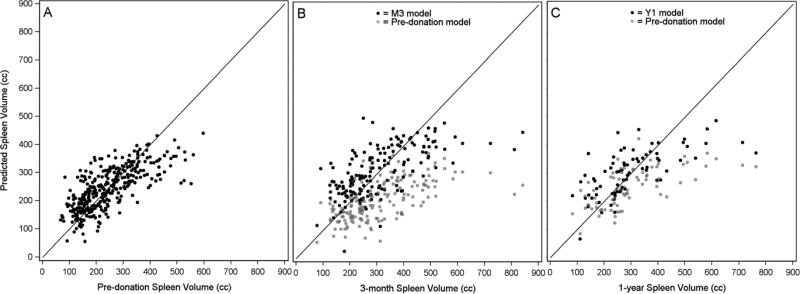
Figure 5.
Predicted vs. observed spleen volumes by time point. Panel A shows pre-donation predicted values calculated using the pre-donation spleen volume model (N=345). In Panels B (N=167) and C (N=75) the black dots show post-donation predicted values using the 3-month (M3) and 1-year (Y1) spleen volume models, respectively, and the light gray dots show predicted values calculated based on the pre-donation spleen volume model.

